IELTS Speaking:
IELTS Writing:
"Success is just a matter of time."
IELTS Speaking Services:
IELTS Writing Services:
Everyday English Services:
"The sky is the limit. We can help you reach it!"
"Let's get to know each other."
Improve Through Writing
Writing Task 1 showing a line graph of U.S. energy consumption.
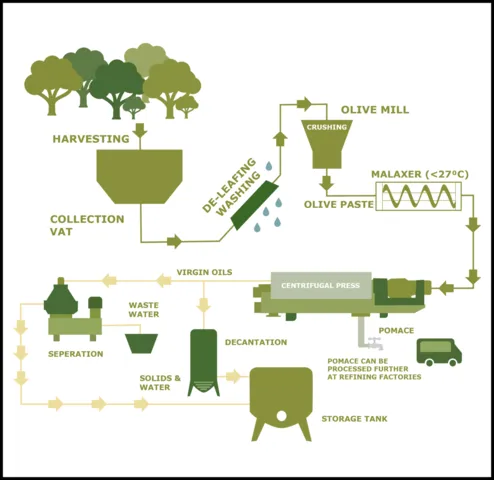
Writing Task 1 diagram showing the process of making olive oil.
Writing Task 1 table showing the consumption of butter and milk among different age groups.
Writing Task 1 graphic about electrical appliances and housework.
Writing Task 1 graphic about sodium, saturated fat and added sugar intake in the US.
Writing Task 1 map showing the redesign and development of a science park.
Writing Task 1 map showing a change at an airport from now to one year later.
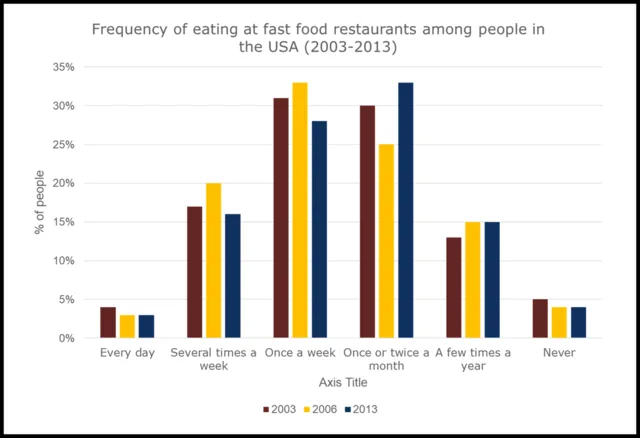
Writing Task 1 about frequency of eating fast food among different years in the US.
Writing Task 1 diagram about a hydroelectric dam making energy.